Build composable charting components in React.
Summary
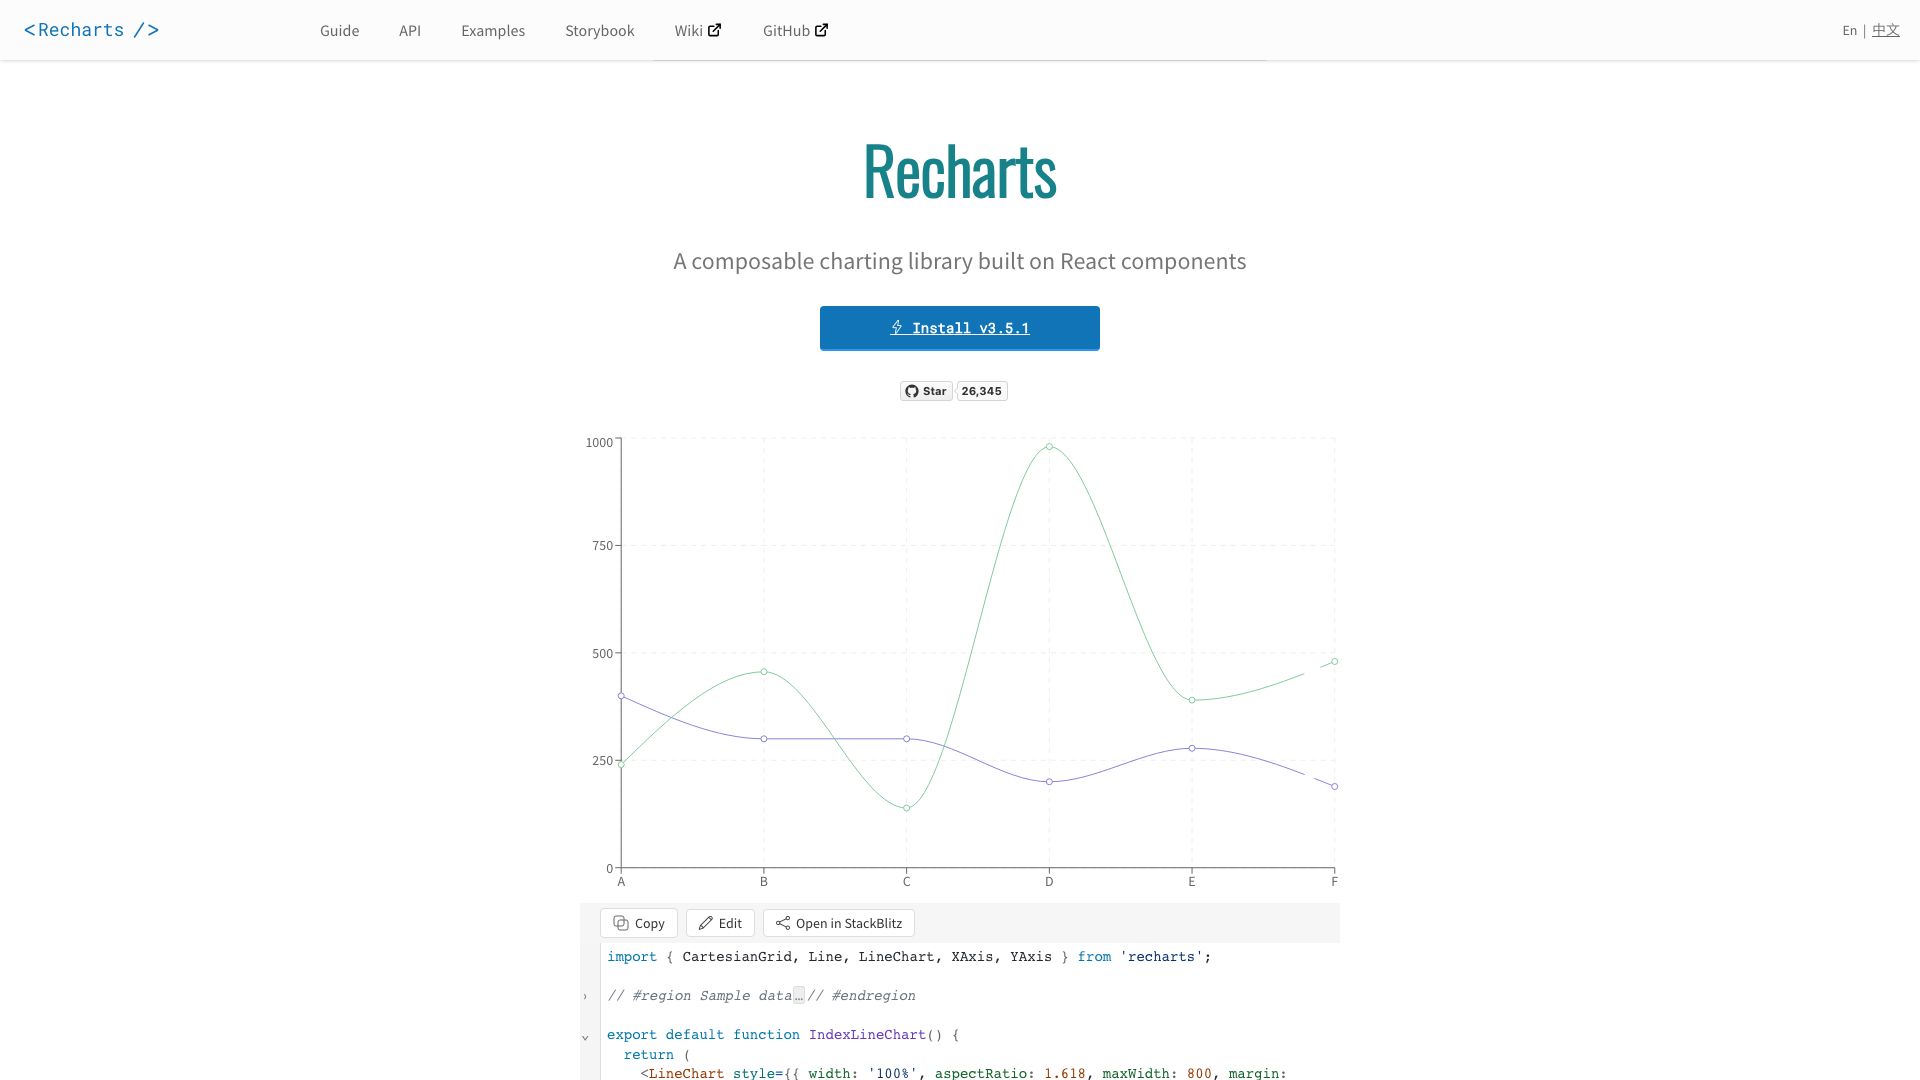
Recharts is a composable charting library built on top of React components. It's designed to make it easy to create interactive and visually appealing charts for your web applications.
Instead of relying on traditional DOM manipulation, Recharts leverages React's declarative nature. This means you describe what your chart should look like, and Recharts handles the rest, rendering the appropriate SVG elements. This approach leads to more maintainable and understandable charting code, especially within a React ecosystem.
The library offers a wide range of chart types, from simple bar and line charts to more complex scatter and pie charts. Its composable design allows you to combine different components to build highly customized and dynamic visualizations that seamlessly integrate with your React application's state and logic.
Key Features
- Declarative API powered by React components
- SVG-based rendering for excellent performance and scalability
- Composability: Combine chart components for custom visualizations
- Rich set of chart types (Bar, Line, Area, Pie, Scatter, Radar, etc.)
- Interactive features (tooltips, legends, zooming, brushing)
- Customization: Easy styling and data formatting
- Server-side rendering support
- Excellent documentation and community support